Last week, I made an effort to investigate some of the findings
of a recent Scotia Capital report, which itself sought to dispel some
of the alleged myths pervading the Canadian wireless market. Some of my
conclusions were based on slightly older numbers, taken from a 2011
version of the Bank of America Merrill Lynch Global Wireless Matrix.
Since stats such as revenue and profits don't change that quickly over
the course of a year, I felt it was okay to use those numbers.
I've since acquired more recent data, as of the third quarter of 2012, which paint a much more accurate and up-to-date picture. BofA's Global Wireless Matrix is something of a bible for the wireless industry, packed with thorough statistics on virtually every carrier in 50 developed and developing countries. The regular report is the most accurate measure and comparison of wireless carriers around the world, which is probably why the Canadian industry and its allies don't want the public to see it. The report details just how well they're doing and does much to prove that Canadians are indeed paying high prices.
The whole document is too bulky to post, but here's a PDF of the key comparison chart. I've also pared the data down into some easier-to-digest charts to compare specific key metrics. Let's start with penetration:

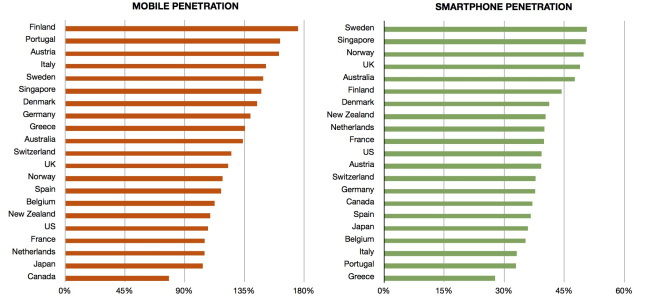
It's no secret Canada has always been behind in overall cellphone penetration. The Matrix confirms that Canada is dead last among 21 developed countries, at 78 per cent. Only four countries in the entire Matrix have worse penetration: Bangladesh, India, Pakistan and Nigeria.
However, the story that has been propagated by carriers and a few other studies, such as comScore, is that Canada is among the world leaders in smartphone adoption. That's clearly not the case according to the BofA numbers, with Canada's 37 per cent penetration actually ranking below the developed world's average of 38.9 per cent.
What those other numbers (and boasts) likely measure is the percentage of cellphone users who are actually smartphone users. Carriers here might be doing well in converting the first into the second, but the fact is, overall there just aren't that many Canadians using smartphones as there are in other countries.
One of the myths (#7) the Scotia Capital report aimed to disprove was that Canada wasn't really behind in wireless services. The report instead claimed Canada was ahead of the U.S. in smartphone penetration and had outpaced its growth over the past two years. The growth claim is correct, according to BofA's numbers, but the U.S. was slightly ahead at 39 per cent penetration, proving Scotia Capital incorrect.
Why is Canada lagging in both overall and smartphone penetration? High prices have been identified and accepted by the government as the main problem. Here's how carriers stack up in terms of revenue numbers:

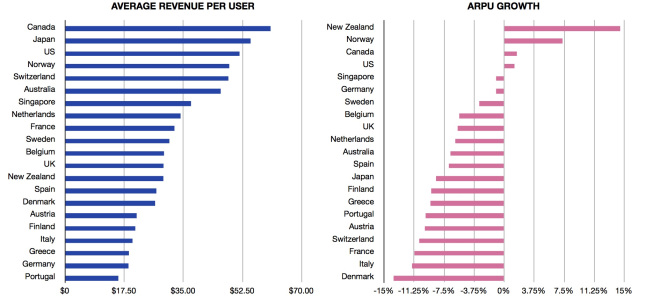
The story here is clear. Canadian carriers lead the world in terms of monthly average revenue per user, at $60.79. That's 16 per cent higher than the United States ($51.61), 32 per cent higher than the developed world average ($43.79) and 76 per cent higher than Europe ($27.02). Moreover, as the graph on the right shows, Canada is only one of four countries seeing ARPU growing. Cellphone bills almost everywhere else are going down, which is probably what they should be doing given that wireless serviceis a technological product, and technology is subject to Moore's Law.
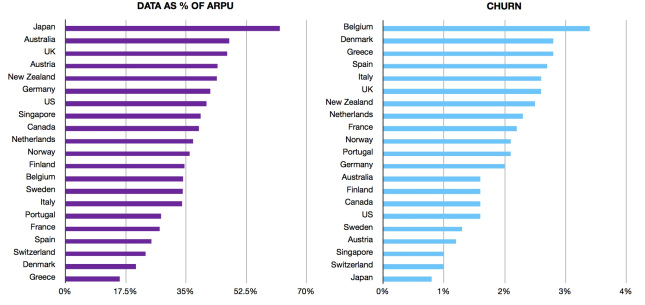
The Scotia Capital report claimed this high ARPU was the result of more people using smartphones in Canada, not high prices, but as the first chart above shows, that's not true. The chart below confirms it. At 38 per cent, Canada is in the middle of the pack in terms of how much of customers' bills are coming from data and below the developed world average of 42 per cent.

The above chart also shows that Canada is on the low side of churn, or how many customers defect to other carriers, which is indubitably the result of three-year contracts. The countries with the highest churn rates are typically those with the strictest contract and phone locking regulations (Belgium used to ban bundling phone sales with monthly service). They're also the ones that typically come in low on ARPU comparisons, which indicates a strong correlation between high monthly prices and low churn. In other words, when customers are able to switch providers easily, prices and ARPU tend to be lower.
Lastly, we come to profit:

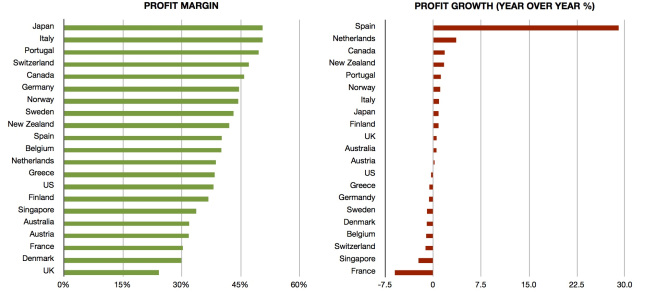
With a margin of 45.9 per cent, Canadian carriers come in at the high end of the most profitable list. They're seven per cent more profitable than their American and European counterparts and five per cent more than the developed world.
Even more interesting is the fact that Canadian carriers had the third-highest year-over-year growth in margins (Spain is comparatively crushing it). Combined with ARPU growth, it's clear that business is good in Canada. Incumbent carriers may have experienced a temporary hiccup thanks to new entrants such as Wind and Mobilicity, but things are obviously getting back to normal.
One of the myths the Scotia Capital report tried to quash (#4) was that the new entrants have had no effect on the market. While they definitely did have an effect, the numbers suggest they've done all they're going to do. The report's conclusion that regulators should "declare victory on the policies they adopted five years ago" when the new entrants were spurred into the market through special rules is therefore not correct.
It's hard if not impossible to look at these key metrics and come to any conclusion other than Canadian wireless carriers are some of the most profitable around based on unmatched monthly revenues, which are coming directly out of consumers' pockets.
Original Article
Source: huffingtonpost.ca
Author: Peter Nowak
I've since acquired more recent data, as of the third quarter of 2012, which paint a much more accurate and up-to-date picture. BofA's Global Wireless Matrix is something of a bible for the wireless industry, packed with thorough statistics on virtually every carrier in 50 developed and developing countries. The regular report is the most accurate measure and comparison of wireless carriers around the world, which is probably why the Canadian industry and its allies don't want the public to see it. The report details just how well they're doing and does much to prove that Canadians are indeed paying high prices.
The whole document is too bulky to post, but here's a PDF of the key comparison chart. I've also pared the data down into some easier-to-digest charts to compare specific key metrics. Let's start with penetration:

It's no secret Canada has always been behind in overall cellphone penetration. The Matrix confirms that Canada is dead last among 21 developed countries, at 78 per cent. Only four countries in the entire Matrix have worse penetration: Bangladesh, India, Pakistan and Nigeria.
However, the story that has been propagated by carriers and a few other studies, such as comScore, is that Canada is among the world leaders in smartphone adoption. That's clearly not the case according to the BofA numbers, with Canada's 37 per cent penetration actually ranking below the developed world's average of 38.9 per cent.
What those other numbers (and boasts) likely measure is the percentage of cellphone users who are actually smartphone users. Carriers here might be doing well in converting the first into the second, but the fact is, overall there just aren't that many Canadians using smartphones as there are in other countries.
One of the myths (#7) the Scotia Capital report aimed to disprove was that Canada wasn't really behind in wireless services. The report instead claimed Canada was ahead of the U.S. in smartphone penetration and had outpaced its growth over the past two years. The growth claim is correct, according to BofA's numbers, but the U.S. was slightly ahead at 39 per cent penetration, proving Scotia Capital incorrect.
Why is Canada lagging in both overall and smartphone penetration? High prices have been identified and accepted by the government as the main problem. Here's how carriers stack up in terms of revenue numbers:

The story here is clear. Canadian carriers lead the world in terms of monthly average revenue per user, at $60.79. That's 16 per cent higher than the United States ($51.61), 32 per cent higher than the developed world average ($43.79) and 76 per cent higher than Europe ($27.02). Moreover, as the graph on the right shows, Canada is only one of four countries seeing ARPU growing. Cellphone bills almost everywhere else are going down, which is probably what they should be doing given that wireless serviceis a technological product, and technology is subject to Moore's Law.
The Scotia Capital report claimed this high ARPU was the result of more people using smartphones in Canada, not high prices, but as the first chart above shows, that's not true. The chart below confirms it. At 38 per cent, Canada is in the middle of the pack in terms of how much of customers' bills are coming from data and below the developed world average of 42 per cent.

The above chart also shows that Canada is on the low side of churn, or how many customers defect to other carriers, which is indubitably the result of three-year contracts. The countries with the highest churn rates are typically those with the strictest contract and phone locking regulations (Belgium used to ban bundling phone sales with monthly service). They're also the ones that typically come in low on ARPU comparisons, which indicates a strong correlation between high monthly prices and low churn. In other words, when customers are able to switch providers easily, prices and ARPU tend to be lower.
Lastly, we come to profit:

With a margin of 45.9 per cent, Canadian carriers come in at the high end of the most profitable list. They're seven per cent more profitable than their American and European counterparts and five per cent more than the developed world.
Even more interesting is the fact that Canadian carriers had the third-highest year-over-year growth in margins (Spain is comparatively crushing it). Combined with ARPU growth, it's clear that business is good in Canada. Incumbent carriers may have experienced a temporary hiccup thanks to new entrants such as Wind and Mobilicity, but things are obviously getting back to normal.
One of the myths the Scotia Capital report tried to quash (#4) was that the new entrants have had no effect on the market. While they definitely did have an effect, the numbers suggest they've done all they're going to do. The report's conclusion that regulators should "declare victory on the policies they adopted five years ago" when the new entrants were spurred into the market through special rules is therefore not correct.
It's hard if not impossible to look at these key metrics and come to any conclusion other than Canadian wireless carriers are some of the most profitable around based on unmatched monthly revenues, which are coming directly out of consumers' pockets.
Original Article
Source: huffingtonpost.ca
Author: Peter Nowak

No comments:
Post a Comment