Canada is among the developed countries that do the least to reduce income inequality, according to an analysis from Mother Jones’ Kevin Drum.
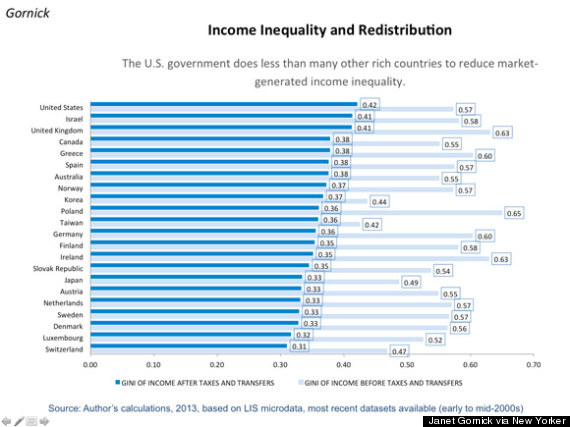
Drum looked at the degree of income inequality before taxes and government transfers, and compared those numbers to the degree of income inequality after taxes and transfers, for various developed countries.
Not surprisingly, he found the U.S. was worst when it came to ironing out inequality. Taxes and government transfers reduce inequality by about 26 per cent in the U.S.
But Canada fared little better, coming in third, tied with Australia and behind Israel, out of 22 countries surveyed. Canadian governments reduce inequality by about 31 per cent, Drum found.
Drum’s data is based on income inequality research carried out by Janet Gornick, a professor of political science at the City University of New York, whose work appeared in this recent New Yorker article.
Some interesting tidbits from Gornick’s research: U.S. incomes before taxes and transfers are surprisingly equal — pre-tax inequality is roughly the same in the U.S. as in Sweden or Norway.
But the U.S.’s tax system, which provides all sorts of loopholes for the wealthy, does far less than Sweden’s (or anyone else’s) tax code to reduce inequality. Thus the U.S. ends up with the highest after-tax income inequality, despite being naturally no more unequal than other countries.
In Canada, our pre-tax incomes are slightly more equal than the U.S. or Sweden. On that measure, Canada ranks 13th of 22 countries — right in the middle of the pack.
But when taxes and transfers are taken into account, Canada shoots up on the inequality rankings, and becomes the fourth most unequal of 22 countries, behind the U.S., Israel and the U.K. (See chart below.)
That means Canadian policies do far less than the policies of most other countries to reduce inequality.
Canada’s tax reforms of recent years have largely favoured corporations. The federal corporate tax rate has been nearly cut in half since 2000 -- from 28 per cent at the turn of the century to 15 per cent in 2012. Personal income tax brackets have fallen only slightly during that time.
Opposition politicians have been criticizing the government for hiking EI premiums to $4,277 this year from $3,412 in 2008. Some call it a hidden tax hike that primarily affects low- and middle-income earners. (EI premiums are capped, with everyone earning more than $47,000 paying the same amount.)
A 2007 study from the left-leaning Canadian Centre for Policy Alternatives found that, after years of tax cuts, Canada’s one per cent wealthiest families pay a lower effective tax rate than the country's poorest 10 per cent of families.
Here is Gornick’s chart of measuring inequality, before and after taxes and transfers.
The numbers are each country’s Gini coefficient — the standard measure of income inequality. A Gini coefficient of 0 means everyone in the country earns the same amount of money. A Gini coefficient of 1 means one person earns all the money, and no one else earns anything. Obviously, all countries are somewhere between 0 and 1.
Original Article
Source: huffingtonpost.ca
Author: Daniel Tencer


No comments:
Post a Comment